Tutorial
Select LPI score range.
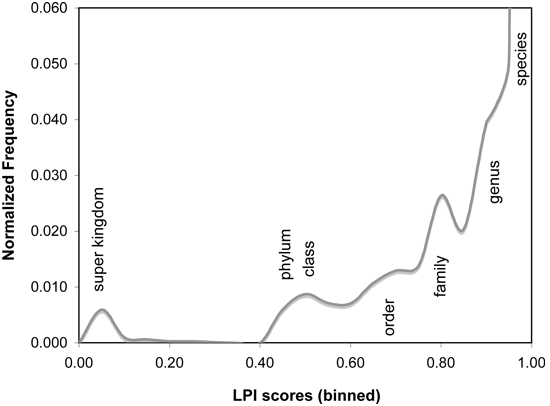
Phylogenetically atypical proteins, which are the most likely potential candidates for horizontal gene transfer, can be detected by selecting only those matches with particularly low LPI scores (e.g. MAX < 0.6). Conversely, to find proteins that would be phylogenetically UNLIKELY as horizontal transfer candidates, a higher LPI score range can be selected (e.g. MIN > 0.75). LPI scores reflect phylogenetic distance of the match sequence from the query organism. Match organisms at similar phylogenetic distances recieve similar LPI scores, regardless of their database abundance. This feature is helpful in compensating for database bias in number of sequences associated with different taxonomic groups.As a guide to LPI score selection, LPI score frequencies for 955 microbial genomes are shown below, binned in increments of 0.05 score units. Proteins with LPI scores below 0.6 typically have no database matches closer than the phylum or class level, indicating strong phylogenetic discordance. LPI scores greater than 0.75 indicate that database matches exist in the same phylogenetic family, suggesting horizontal gene transfer is unlikely to be detectable by phylogenetic methods. Intermediate scores are typically borderline cases, which may be difficult to interpret. In some cases, available data may be insufficient to resolve whether or not HGT has actually occurred.
Select phylogenetic granularity.
Phylogenetic granularity describes the breadth of "self" sequences excluded as possible matches during a DarkHorse search. HGT events of different ages can be targeted by choosing different levels. Relative age of potential HGT events can be explored for a particular protein of interest by comparing its LPI scores at different phylogenetic granularities and looking for a point where the score changes from high to low.Strain level is the narrowest possible granularity choice. This setting is most useful for identifying relatively recent HGT events, because the low LPI proteins it finds are unique to a particular strain, not present in other strains of the same species. Using Burkholderia cenocepacia AU 1054 as an example, strain level granularity excludes all matches to database entries specifically labeled as belonging to strain AU1054, while still permitting matches to organisms like Burkholderia cenocepacia PC184 and Burkholderia cenocepacia MC0-3. Matches to these other strains of Burkholderia cenocepacia will receive high LPI values, but matches unique to strain AU1054 will receive lower LPI values.
Species level granularity widens the list of excluded organisms. It can identify older HGT events by finding low LPI proteins unique to a particular species, absent from all other sequenced species of the same genus. In the previous example, this level of granularity would exclude matches to all strains of Burkholderia cenocepacia, but still allow matches to Burkholderia dolosa and Burkholderia xenovorans.
Genus level granularity widens the exclusion list still further, excluding matches from all species within the same genus. In this case, no matches would be allowed to any members of the Burkholderia genus. Low LPI sequences found in only one genus, absent from all other known members of the same family, may represent more ancient HGT events.
Users should keep in mind that predicting the age of HGT events requires some caution, because phylogenetically atypical proteins with low LPI scores can occur for two different reasons: either gene gain by the query organism, or gene loss from its closest known relatives. In cases where the query organism is the only sequenced example at a particular taxonomic level, it may not be possible determine age of gene acquisition until more data on related organisms becomes available.
Post-processing options.
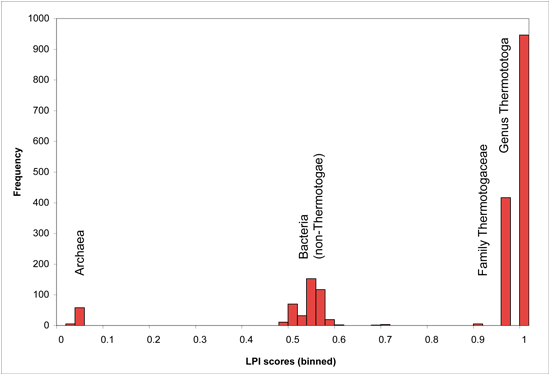
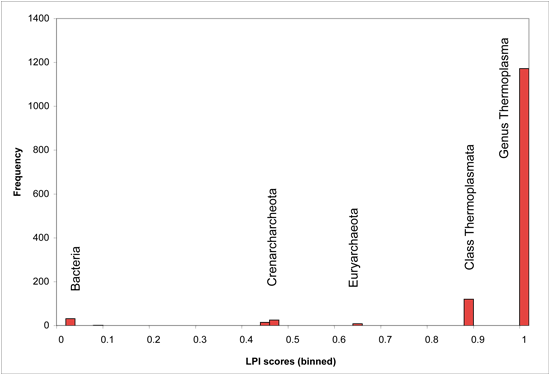
Optimal cutoff points may vary for individual genomes, depending on branch lengths of the phylogenetic trees underlying their lineage descriptions, as well as phylogenetic distance between available sequenced genomes. Users may wish to adjust LPI score cutoffs after viewing the genome-specific histogram presented on the DarkHorse results summary page for their organism of interest. Genome-specific LPI histograms usually contain several obvious break points in the distribution, as shown in the following examples (binned in score increments of 0.02 units).
LPI Score Histogram for Thermotoga lettingae
LPI Score Histogram for Thermoplasma acidophilum
Coding sequence location coordinates can indicate whether horizontal transfer candidates are adjacent or distant from each other, or located on the same chromosome, scaffold, or plasmid.
DNA composition statistics include percent GC for each individual protein coding sequence, as well as mean and standard deviation for percent GC of all coding sequence regions in the parent genome. Percent GC is sometimes used as a simple marker of foreign DNA within a genome, although there may be a wide disparity between individual genes due to other factors.
BLAST match statistics include alignment length, percent identity, e-value, and bitscore, as well as percent of the protein covered by the alignment. It also includes number of database matches included as potential orthologs during DarkHorse analysis. A high number of database matches indicates a protein that is conserved and well represented in database. Unusual or rapidly evolving proteins have fewer database matches. The "best" match sequence selected by the DarkHorse algorithm represents the closest database relative of potential donor organisms, whether by vertical or horizontal transmission.
References
- Podell, S and Gaasterland, T (2007). DarkHorse: A method for genome-wide prediction of horizontal gene transfer. Genome Biology 8(2):R16
- Podell, S Gaasterland, T, and Allen, EE (2008). A database of phylogentically atypical genes in archaeal and bacterial genomes, identified using the DarkHorse algorithm. BMC Bioinformatics 9:419
- Examples of recent citations on GoogleScholar.